2D points 3D Objects 3D Points Boundary Cursor position Data for selected object Domain Expansion Field Field components Field formula Field tubes Function Generate expansions along 2D boundary Generate expansions for 3D objects Grid formula Grid transformation Info and movie directives Insert Integral Modify 2D expansions MMP Movie Open GL window PET basis PFD (predefined FD) Project Space, plane, arrow, or point Tools and draw Transformation data Window
Press the window button ![]() or
select Window... from the Tools menu to
open this dialog.
or
select Window... from the Tools menu to
open this dialog.
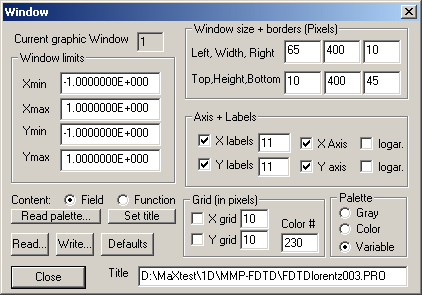
The Window dialog contains all the data for the current graphic window. If you are working with several graphics windows, click on the desired window before you open the Window dialog. The number of the current window is displayed in the Current graphic window box.
The main purpose of the graphic window is to map a rectangular portion of the XY plane on the screen. The limits of this rectangular area in Cartesian coordinates can be specified in the Xmin, Xmax, Ymin, Ymax boxes.
The graphic window is either used for displaying functions or fields (including boundaries and expansions). When a function is drawn, the x axis is labeled with the title of the X argument and that the y axis is labeled with the title of the Y argument of the function. Check the Function box to activate this type of labeling. When the Field box is checked, the x and y axis will be labeled with the corresponding data of the vectors in 3D space that are tangential to the x and y direction of the window. Note that the Function box is automatically checked as soon as a function is drawn, whereas the Field box is automatically checked when the field, a boundary, or an expansion is drawn.
The space that the graphics window occupies is specified in pixels. Space can be allocated outside of the rectangular area where the graphic is drawn for labeling and for some textural output. You can set the size of the window and its borders in the corresponding boxes of the Window size + borders group.
To draw the X and Y axes in the window, check the corresponding boxes. Labels indicating the X and Y coordinates are drawn along the sides of the rectangular area when the corresponding boxes are checked. You can also specify the number of labels you would like. OpenMaXwell tries to find nice labels, i.e., it tries to set the labels at positions with simple numeric values. To achieve this goal, OpenMaXwell might select a number of labels that is slightly different from the number of labels specified by the user. For example, when you specify 10 labels along the x axis with Xmin=-1, Xmax=1, OpenMaXwell will set 11 labels at the positions X=-1, -0.8, …, +1 and not 10 labels at the positions –1, -0.77777, …, +1.
Usually, linear scaling in both the X and Y directions is used. Sometimes, logarithmic scaling is preferable and can be turned on by checking the corresponding logar. boxes. Note that logarithmic scaling requires that the data to be displayed and the window limits are strictly positive.
For graphic input, the resolution of most graphic monitors is too high, which makes the positioning of the cursor to the desired location very difficult. You can reduce the resolution for the mouse input by setting an appropriate spacing in the X grid and Y grid boxes respectively. Usually, this grid is invisible. It becomes visible when you check the X grid and Y grid check boxes. Note that you can also specify the color of the grid lines.
OpenMaXwell uses 1) a standard Gray, 2) a standard Color, and 3) a user-definable, Variable palette. You can select one of these palettes in the corresponding boxes. By pressing Read palette... you may select a palette file containing the palette information. Such files may be created with arbitrary ASCII text editors or with the MaX-1 software.
The standard title of the graphic windows is OpenMaXwell Graphics, but you can rename this in the corresponding edit box. When you press the Set title button, the title will be set to the path + name of the current project.
Press the Read… button to read window data from a file. A file name dialog will allow you to select a file name to read.
Press the Write… button to write window data to a file. A file name dialog will allow you to select a file name to write to.
If you have modified some data but wish to return to the default settings, you can press Default.
Press the Close button to close the dialog. Note that the data in the dialog becomes effective once the dialog is closed.
Responsible for this web page: Ch. Hafner, Computational Optics Group, IEF, ETH, 8092 Zurich, Switzerland
Last update
17.02.2014