PCs sharp bend design and optimization


Figure
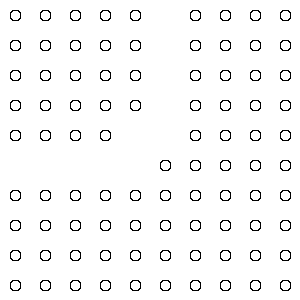
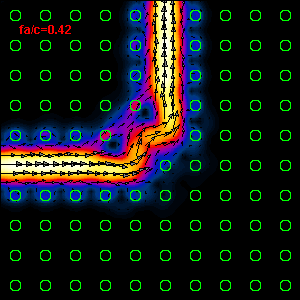
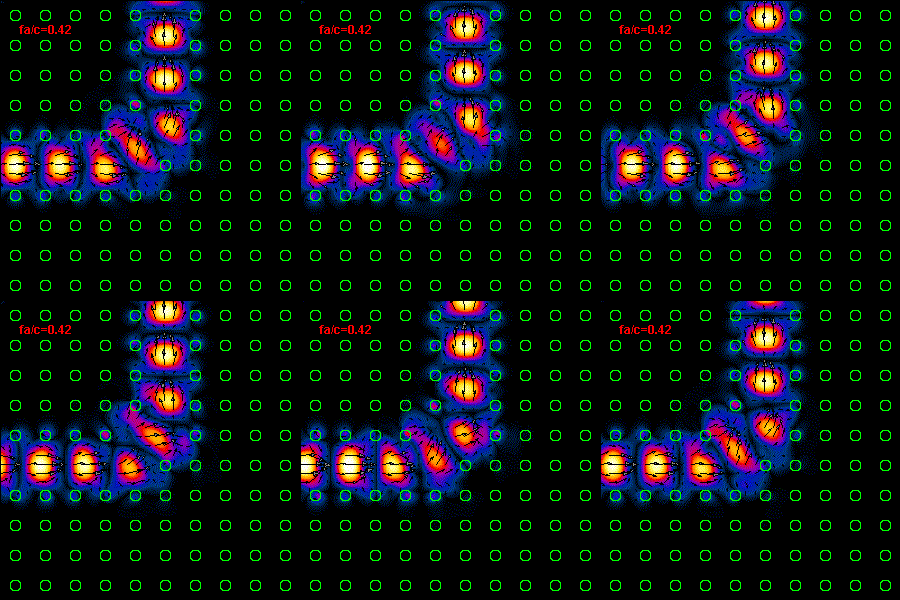
1: The initial design of the PCs 90 deg. bend is presented. An initial information about
a used perfect crystal and
line defect PCs waveguide
(material properties, geometry and band structure) can be found using the
following link:
"perfect crystal and line
defect waveguide data". In the left hand side figure is shown geometry of the initial PCs bend design.
The time average Poynting vector and an infrared light propagation are given in
the middle and in the right hand side figure, respectively.
Figure
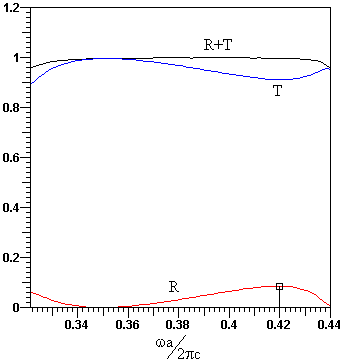
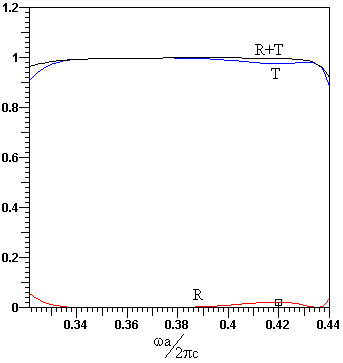
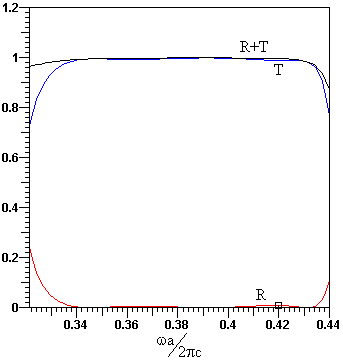
2: The frequency characteristic of the PCs 90 deg. bend is shown. It is
calculated for the bandgap frequency range. As one can see
we have a very high quality bending at certain frequencies (100% transmission),
and the maximum of reflection is achieved at fa/c=0.42
where
we have obtained the reflection coefficient value R=8.6% (by means of power).
In
order to suppress this reflection maximum we will perform the design optimization at this critical frequency.
Figure
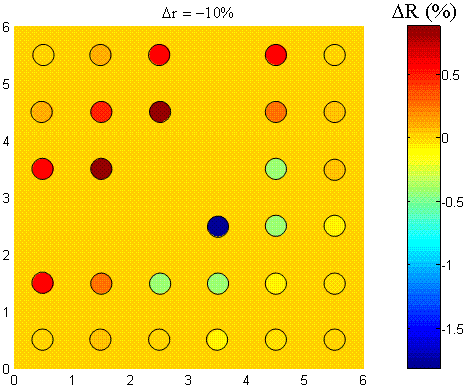
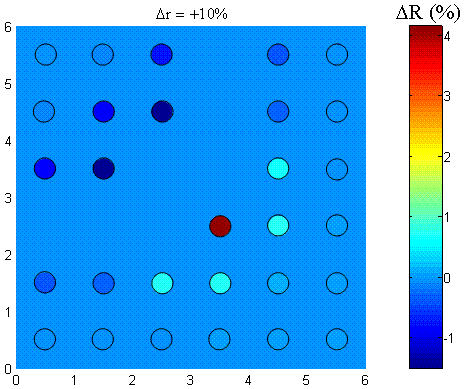
3: We will try to optimize this structure only by changing the rod radius (a
reasonable computation time). In order to find the most important rods in the
structure we have performed a sensitivity analysis, i.e. we have increased and than
decreased the radius for 10% of
36 rods surrounding the bend center. For every single different rod radius, we have calculated
the reflection and the transmission coefficient. Having these data, it is possible to
calculate the reflection difference between the initial and slightly modified
structure (a single rod radius is changed). The left hand side figure is
visualization of these reflection differences for -10% change of
rod radius and the right hand side figure corresponds to +10% change of radius.
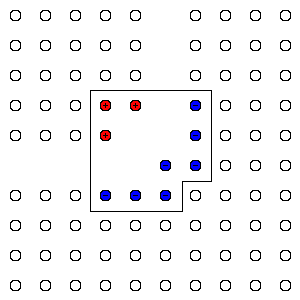
Figure 4: Using results presented in Figure 3 it is possible to select the most sensitive or the most important rods in our PCs structure. In order to reduce the computation time (i.e. to reduce the size of computational domain) we have selected the most significant rods (10 rods around the bend center) for radius change. For every single rod we have to decide about increasing or decreasing the radius. In this figure the rod that should be spread is marked with "+" (red rods) and the rod for shrinkage is marked with "-" (blue rods).
Figure
5: After selection of an important rods that should be increased or decreased in
radius we have to decide about a value of radius change
for every single rod. In order to have simple situation from manufacturing point
of view we decided to have the same radius change amount
of all rods. In the first optimization step this amount was ±10% (according to
the figure 4). In the left hand side figure is presented the
frequency
characteristic of the bend after this first step. As one can see the maximum of
reflection is still there but it is significantly
suppressed. Having the
initial result for reflection at the relative frequency 0.42 and the result of
this the firs step solution, it is possible to
estimate the radius change amount
in such a way that we have zero reflection. This is possible, of course, only by
taking an assumption of
linearity. The obtained radius change value
is in this case ±13.27%. The frequency characteristic of this second step
solution is given in the
right hand side figure. Obviously, our optimization
was successful and we have very efficient 90 deg. band (reflection below 1%)
over a wide
frequency range (almost an entire bandgap).
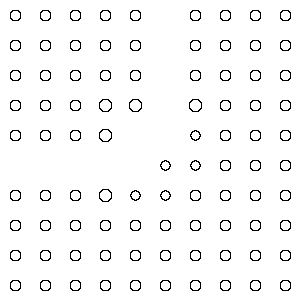
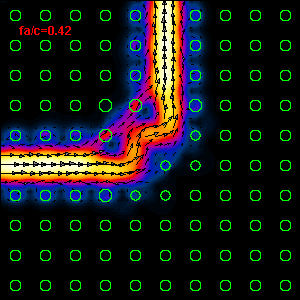
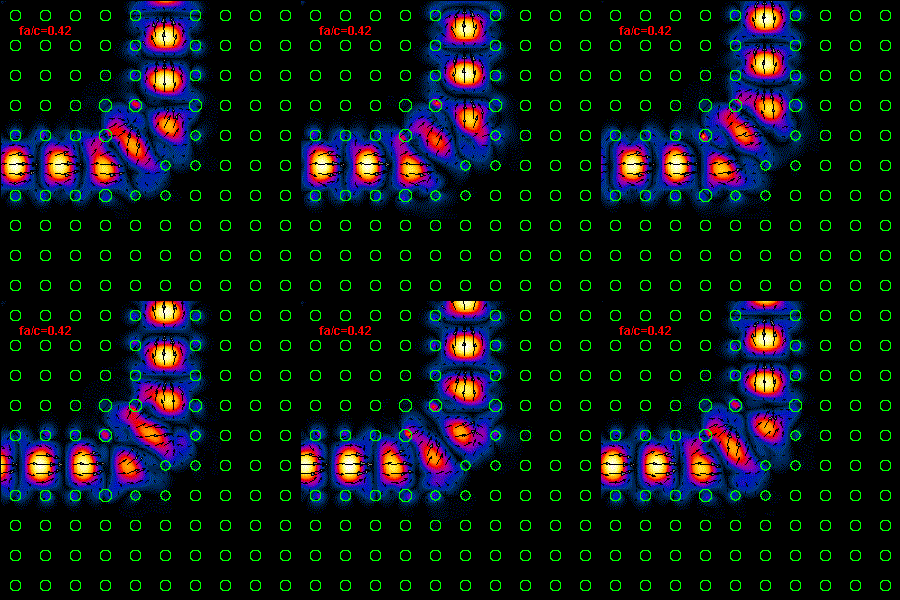
Figure 6: The geometry of the second step solution (the left hand side), corresponding time average Poynting vector field (the middle), and infrared light propagation (the right hand side) are shown. Additional informations and interesting effects can be found using the following link: http://www.opticsexpress.org/abstract.cfm?URI=OPEX-11-12-1378. This is the paper about a PCs bend optimization we have already published.