User Forum of Software BASEMENT
| BASEMENTBasic Simulation Environment for computation of environmental flow and natural hazard simulationLaboratory of Hydraulics, Hydrology and Glaciology (VAW)ETH Zurich |
You are not logged in.
- Topics: Active | Unanswered
Pages: 1
#1 2020-04-27 11:07:06
- Matteo Facchini
- Developer
- From: Trento
- Registered: 2014-09-05
- Posts: 281
morphodynamics output
Dear Community,
I am facing a strange problem here: I succesfully run some morphological simulations and I can perfectly display the results with paraview!
Unfortunately, crayfish is having some issues:
some results are missing (ns_hyd_discharge and ns_mor_discharge)
the other results are not as expected, i.e. not the same as what I see in ParaView (which is much more reasonable)
I can solve this by producing some rasters with ParaView and importing them to QGIS.
I will also write on github to the Lutra guys!
Cheers
Matteo
Offline
#2 2020-05-12 09:02:08
- Matteo Facchini
- Developer
- From: Trento
- Registered: 2014-09-05
- Posts: 281
Re: morphodynamics output
Partial answer to my post:
as for point 1: it is reasonable that ns_hyd_discharge is not present in qgis, since it is a nodestring result (time series).
So far still no answers by Lutra people, the link to the request is this
Offline
#3 2020-05-15 16:28:11
- Matteo Facchini
- Developer
- From: Trento
- Registered: 2014-09-05
- Posts: 281
Re: morphodynamics output
Apparently it is a matter of "file format" (not sure what they mean by that!)
Maybe you guys could look up the issue on BASEMENT side and see if it is only me having issues.
Again, the results are ok in ParaView and not corrrectly displayed in QGIS, which is "bad" because one cannot print the results over a georeferenced map.
Offline
#4 2020-05-20 07:08:39
- Matthias Bürgler
- Developer
- From: Zürich
- Registered: 2019-04-04
- Posts: 150
Re: morphodynamics output
Hi Matteo
The visualization with QGIS in the MDAL issue definitely looks strange, but i have not encountered similar issues with displaying the flow velocity in QGIS. I failed to reproduce the issue for the Flaz tutorial (B - unsteady inflow). I cross-verified the flow velocity magnitude in Paraview and QGIS and get the same results (aside from the slightly different color scale):
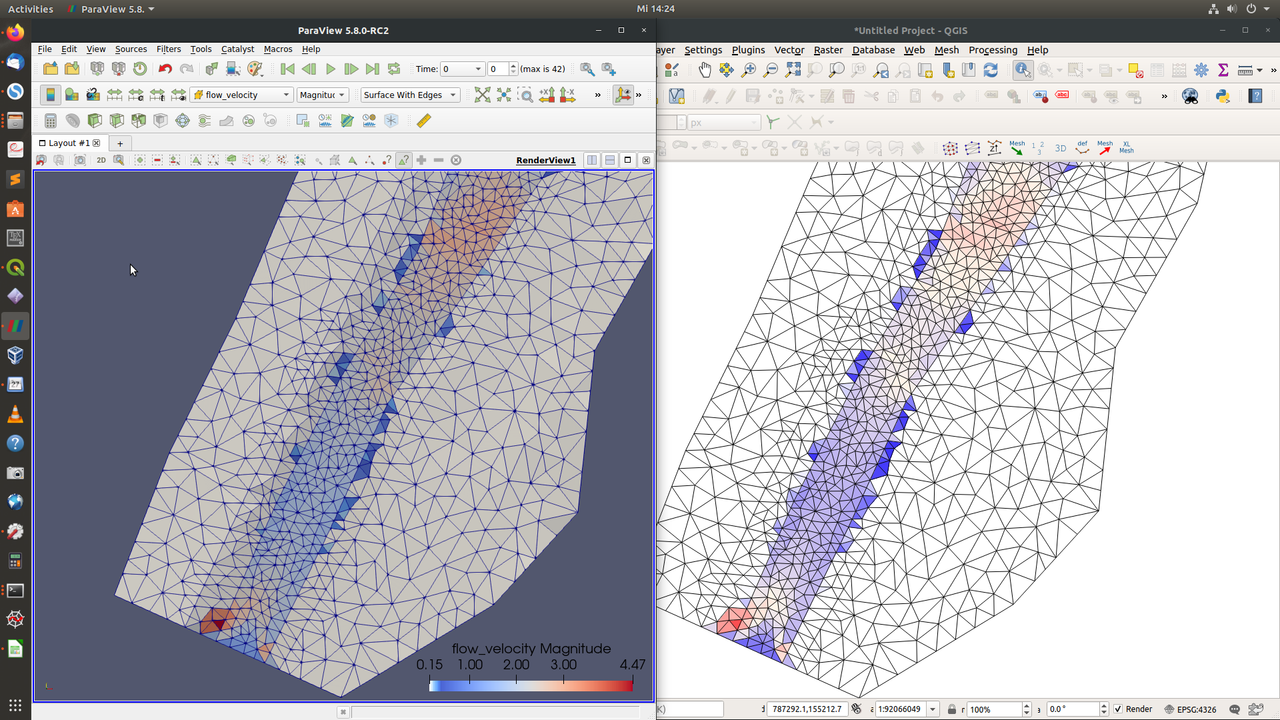
Since we are using different OS, I will see if it is related to this.
I am assuming you were comparing the exact same time step? Maybe you could verify for one specific cell via the cell ID, if the values in the .h5 file match the ones from QGIS or Paraview?
[Update]
Also under Windows I get identical flow velocity magnitudes in Paraview and QGIS. For further investigation it would be helpful to have a test case that reproduces the problem.
Best regards
Matthias
Offline
#5 2020-05-26 09:25:36
- Matteo Facchini
- Developer
- From: Trento
- Registered: 2014-09-05
- Posts: 281
Re: morphodynamics output
Hi Matthias,
I will look it up for sure, and report back to you!
Thanks,
Matteo
Offline
#6 2020-05-26 14:21:23
- Matteo Facchini
- Developer
- From: Trento
- Registered: 2014-09-05
- Posts: 281
Re: morphodynamics output
Hi Matthias,
I tried with the Flaz tutorial and everything works fine.
I will send you the data that cause the mess.
Thanks,
Matteo
Offline
#7 2020-05-27 08:36:21
- Matteo Facchini
- Developer
- From: Trento
- Registered: 2014-09-05
- Posts: 281
Re: morphodynamics output
Case closed thanks to Matthias support: the elements and nodes in the 2dm file must be listed in ascending order. Once this is done everything works fine again.
The problem has been solved on the BASEMENT side by correcting basemesh!
Thanks!
Offline
Pages: 1